Insights overviewUpdated 7 months ago
Welcome to the Insights page—your ultimate dashboard for tracking and analysing your profile's performance. This is where the magic happens. Get ready to revolutionise the way you connect and grow your network with VennCard.
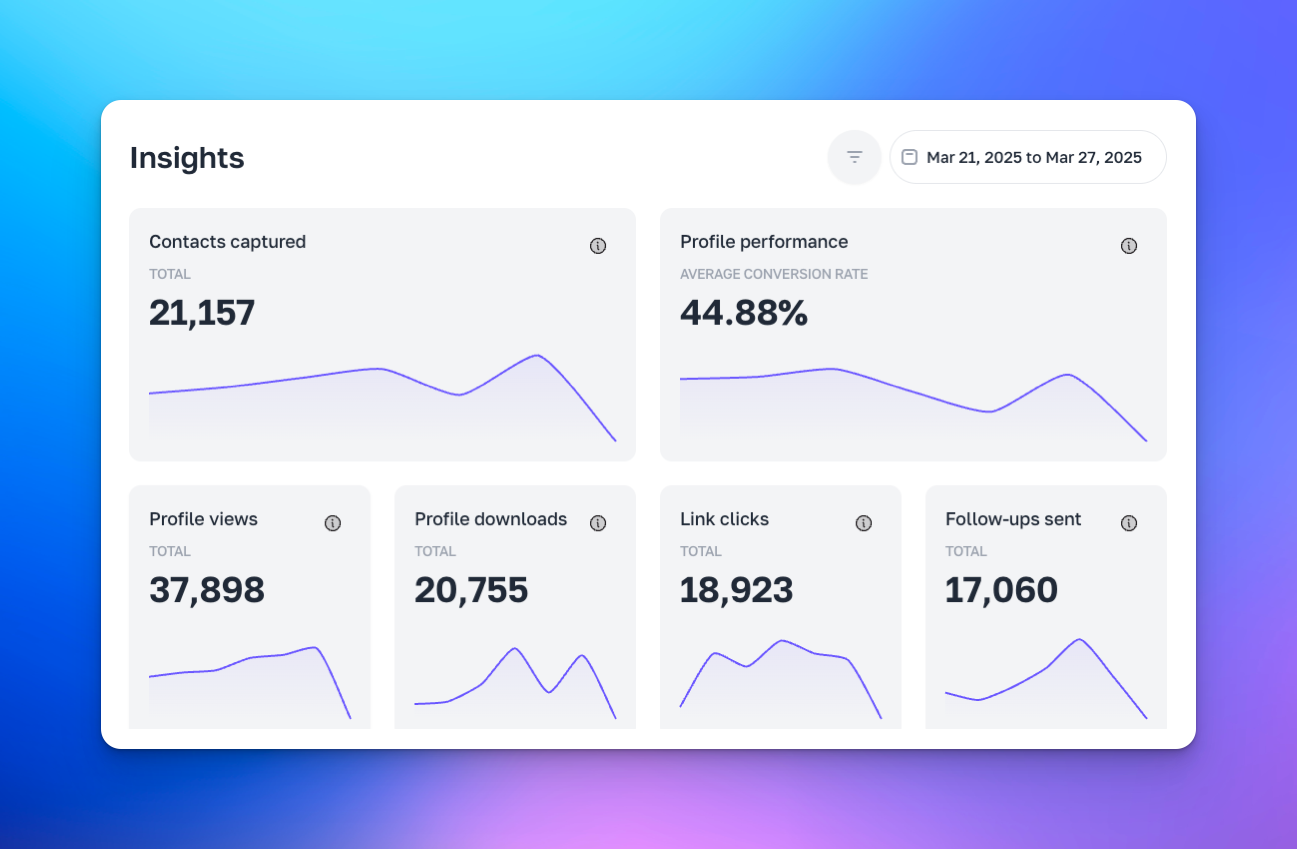
Metrics Overview
The Metrics Overview section is where you get a snapshot of your profile's performance. Here, you'll see four key metrics: Contacts, Profile Views, Contact Downloads, and Follow-Ups. Each metric provides valuable insights into how your profile is performing and how users are engaging with your content.
Contacts captured: This metric shows the total number of contacts you've collected. It's a clear indicator of your networking success and the reach of your profile.
Profile performance: The average conversion rate from profile view to capture.
Profile Views: This metric indicates how many times your profile has been viewed. More views mean more exposure, so keep an eye on this number to gauge your profile's visibility.
Profile downloads: This metric shows the number of times your contact information has been downloaded. It's a strong indicator of interest and engagement from your audience.
Link clicks: A count of Social links and Custom links clicked on your profile.
Follow-Ups: This metric indicates how many follow-up actions have been taken. It's a great way to measure the effectiveness of your networking efforts and the overall engagement with your content.
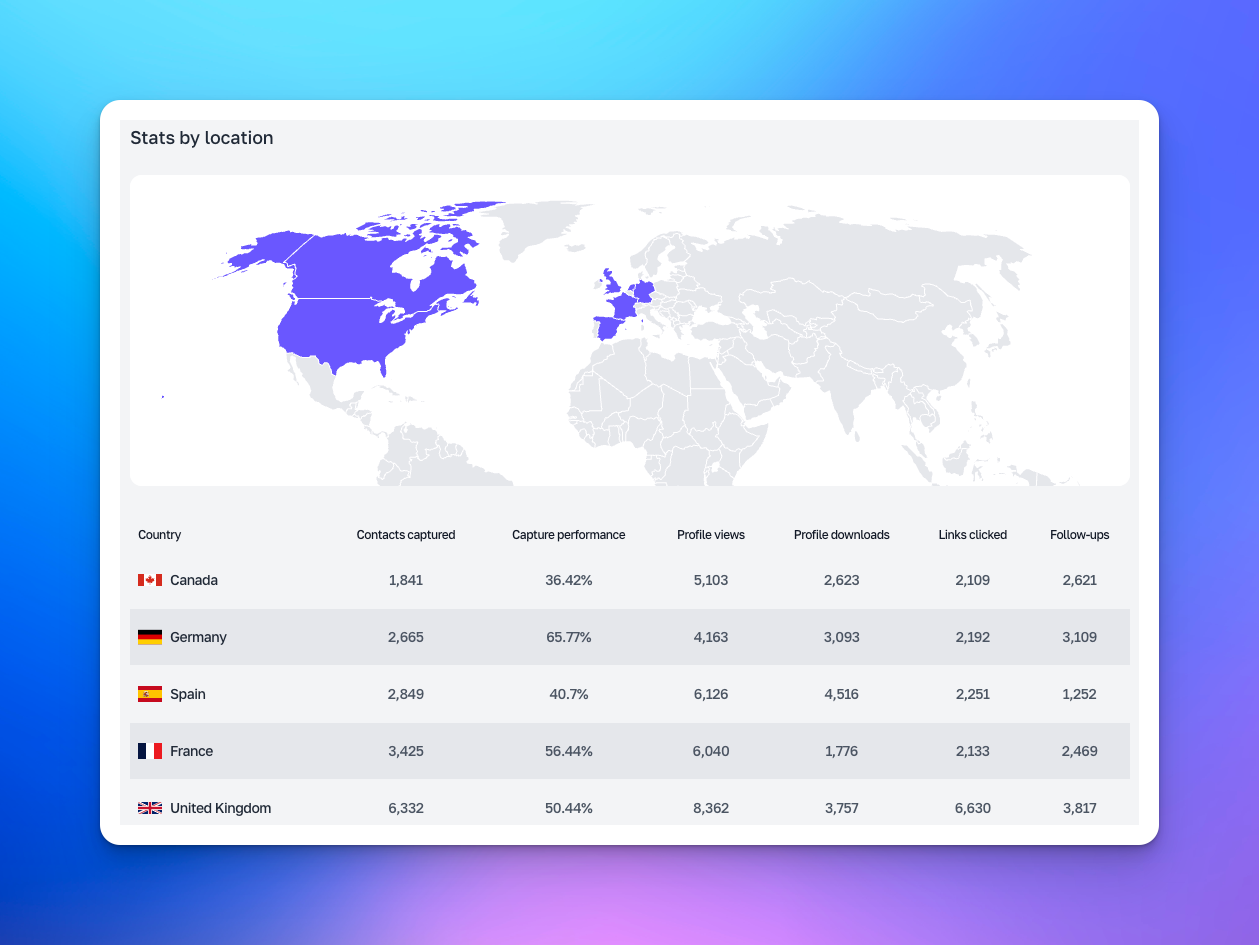
Stats by Location
The Stats by Location section provides a visual representation of where your profile views and interactions are coming from. The world map is colour-coded to show the geographical distribution of your audience. Hover over different regions to see detailed statistics for each location. This information is invaluable for tailoring your content and marketing strategies to specific regions. Whether you're targeting local markets or expanding globally, the Stats by Location section gives you the insights you need to make informed decisions.
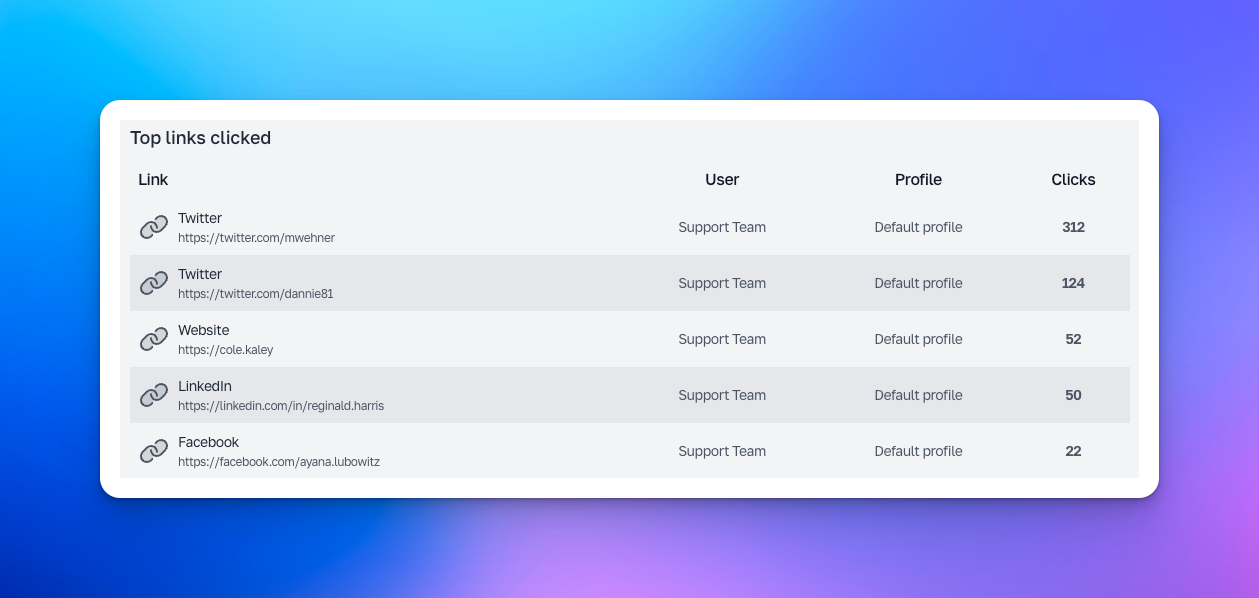
Top Links Clicked
At the bottom of the page, you'll find the Top Links Clicked section. This table displays the most clicked links on your profile, including the user, profile, and number of clicks. Use this information to understand which links are most engaging to your audience. It's a powerful tool for optimising your content and driving more traffic to your key resources. By analysing the top links clicked, you can refine your strategy and focus on what works best.
How to Use
Navigating the Dashboard
The Insights page is accessible from the main navigation menu on the left side of the screen. Once you're on the page, you'll see that it's divided into several sections, each providing different types of information and metrics. The layout is designed to be intuitive and user-friendly, so you can easily find the data you need. For more details on navigating the dashboard, check out our support article on navigation.
Interpreting Metrics
Understanding your metrics is crucial for making informed decisions. Here's a breakdown of what each metric means and how to use it:
Contacts: This metric shows the total number of contacts you've collected. It's a clear indicator of your networking success and the reach of your profile.
Profile Views: This metric indicates how many times your profile has been viewed. More views mean more exposure, so keep an eye on this number to gauge your profile's visibility.
Contact Downloads: This metric shows the number of times your contact information has been downloaded. It's a strong indicator of interest and engagement from your audience.
Follow-Ups: This metric indicates how many follow-up actions have been taken. It's a great way to measure the effectiveness of your networking efforts and the overall engagement with your content.
Using Filters
The date range filter at the top right allows you to select the date period for which you want to view the metrics. Adjust the date range to see how your metrics have changed over time. This feature is particularly useful for tracking the impact of specific campaigns or events. By comparing different time periods, you can identify trends and make data-driven decisions. For more information on using filters, visit our support article on filters.
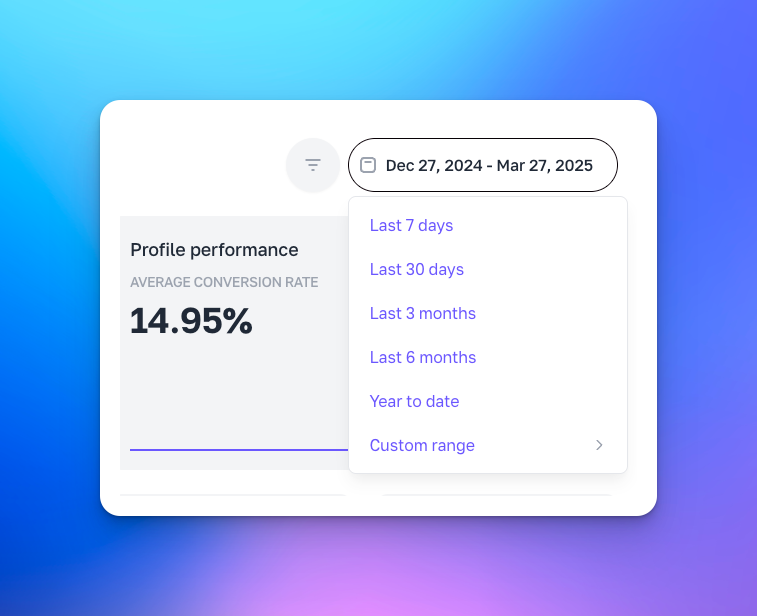 Filter by Date range
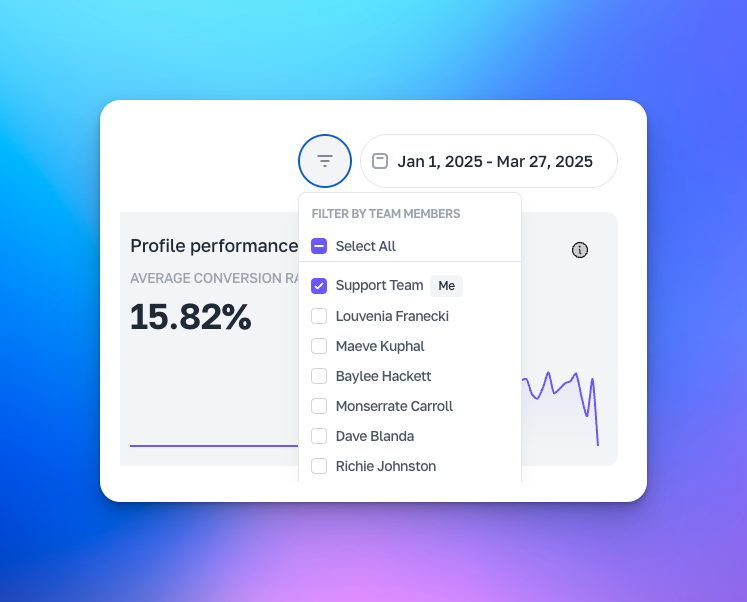 Filter by Team member
Understanding Stats by Location
The world map in the Stats by Location section provides a visual representation of where your profile views and interactions are coming from. Hover over different regions to see detailed statistics for each location. This information is invaluable for tailoring your content and marketing strategies to specific regions. Whether you're targeting local markets or expanding globally, the Stats by Location section gives you the insights you need to make informed decisions.
Analysing Top Links Clicked
The Top Links Clicked section shows the most clicked links on your profile. Use this information to understand which links are most engaging to your audience. It's a powerful tool for optimising your content and driving more traffic to your key resources. By analysing the top links clicked, you can refine your strategy and focus on what works best. For more tips on analysing link performance, check out our support article on link analysis.
Search and Filter UI Elements
The search bar at the top of the Insights page allows you to quickly find specific data points or sections. Simply type in a keyword or phrase, and the relevant results will be highlighted. This feature is particularly useful for navigating large datasets and finding specific information without scrolling through the entire page.
The filter options next to the search bar enable you to refine the data displayed on the Insights page. You can filter by date range, contact tags, and other criteria to focus on the most relevant information. These filters help you customise the view to match your specific needs and objectives.
Tips and Best Practices
Pro Tip
Regularly Check Your Metrics: Make it a habit to regularly check your Insights page to stay updated on your profile's performance. The more you know, the better you can optimise.
Troubleshooting
- Metrics Not Updating: If your metrics are not updating, try refreshing the page or adjusting the date range filter. Sometimes a simple refresh is all it takes.
- Incorrect Data: If you notice any discrepancies in your data, ensure that your profile and tags are set up correctly. Double-check your settings and make sure everything is in order.
- Loading Issues: If the page is not loading properly, check your internet connection and try clearing your browser cache. A stable connection and a clean cache can resolve most issues.
This documentation provides a comprehensive guide to using the Insights page effectively. If you have any specific features or interactions you'd like to highlight further, please let me know!